Service
Data Dashboard & Analytics Platform Development, UK
Turn your data into decisions: dashboards that your team will actually use.
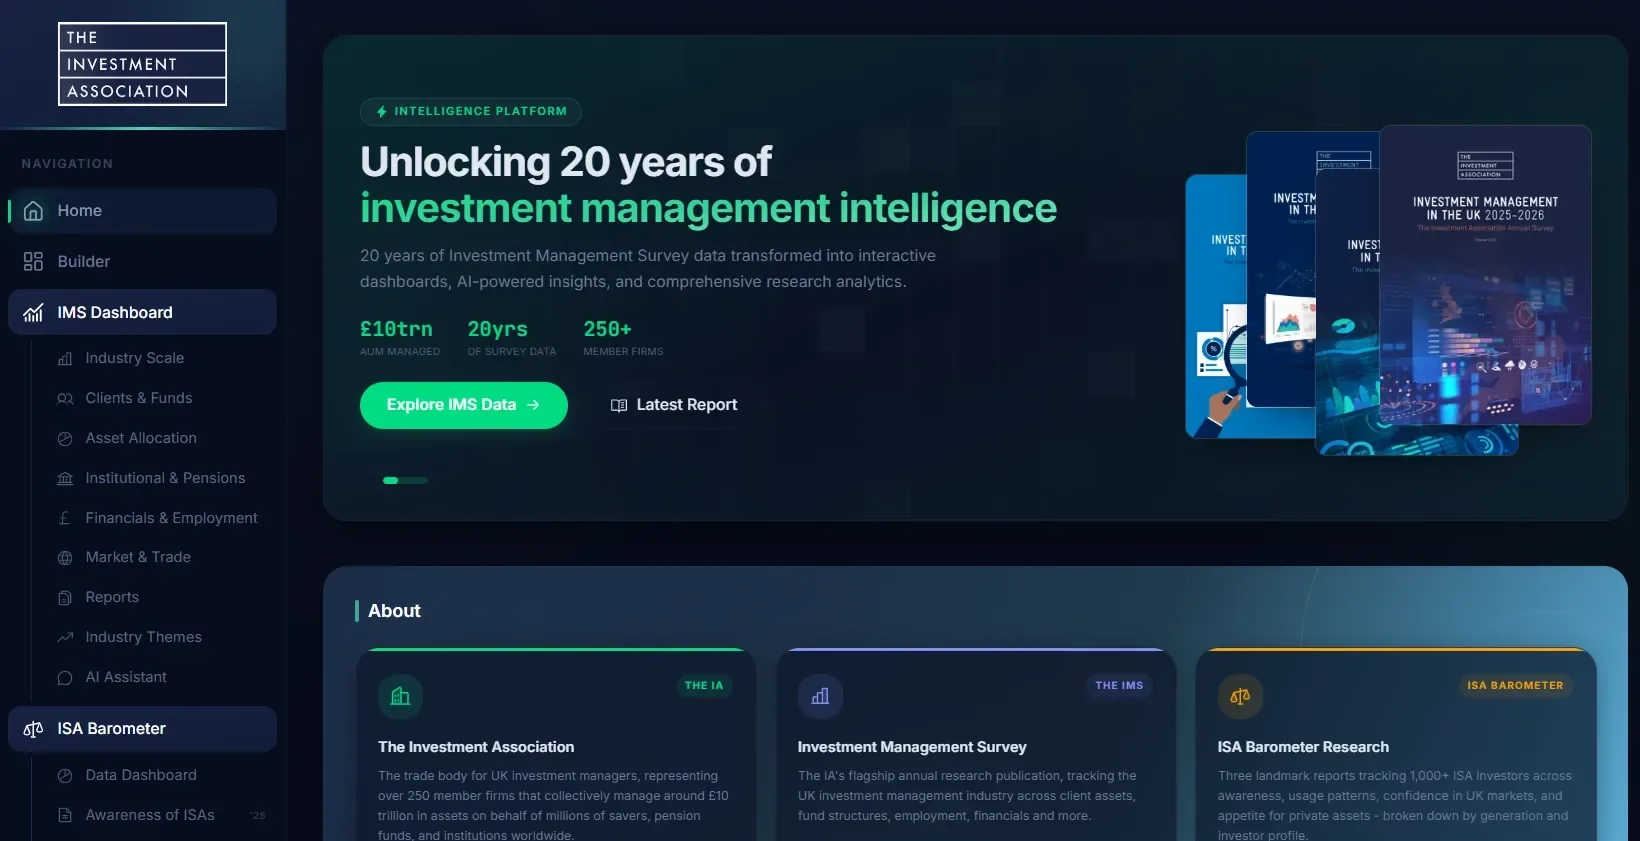
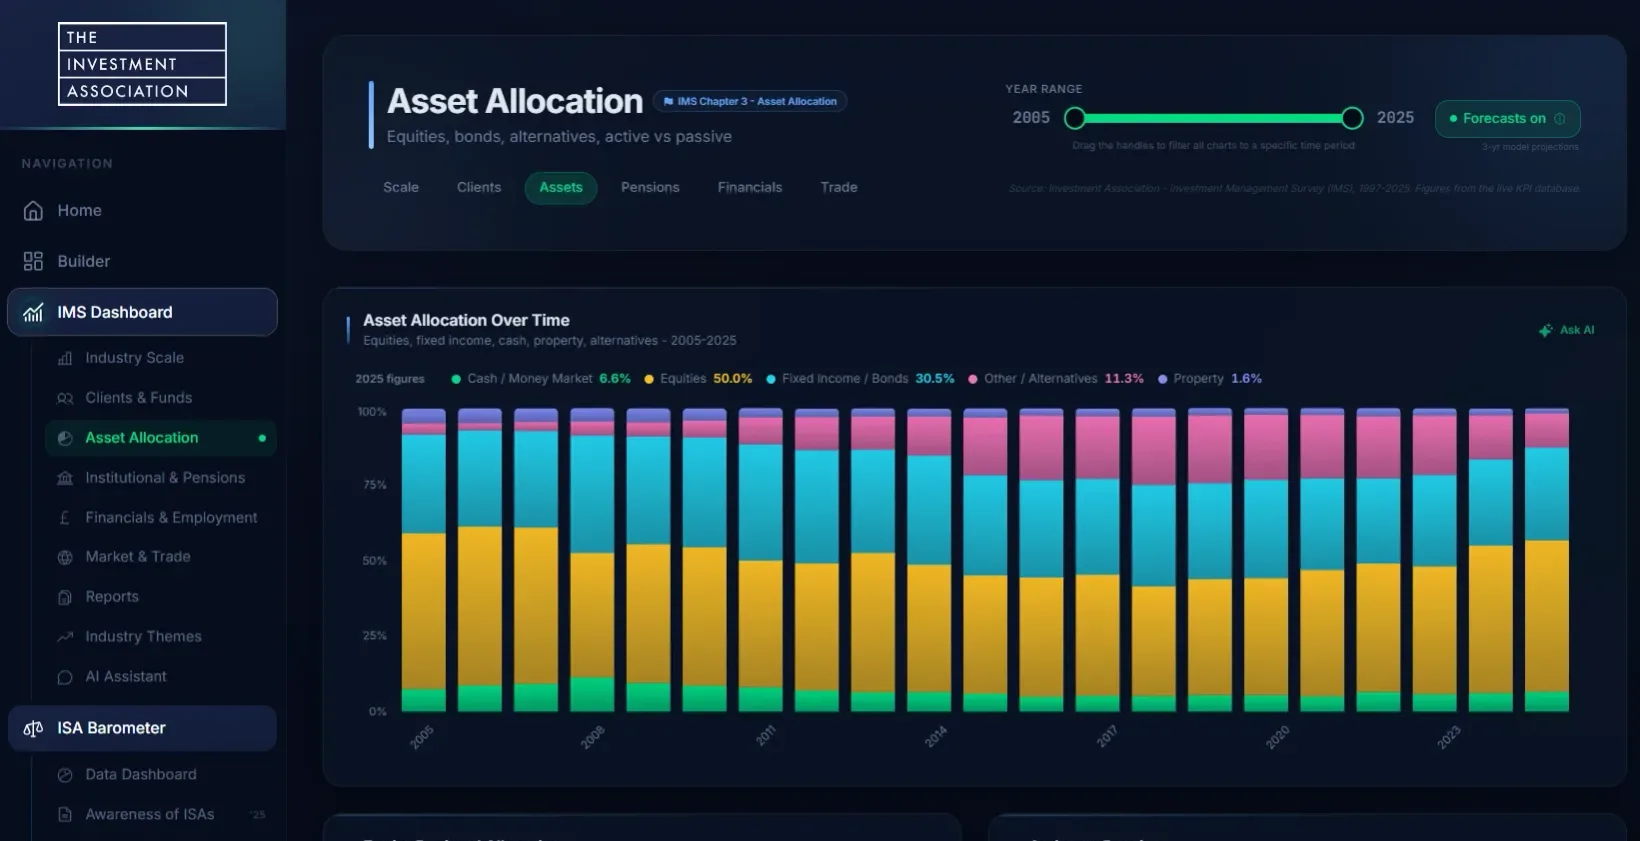
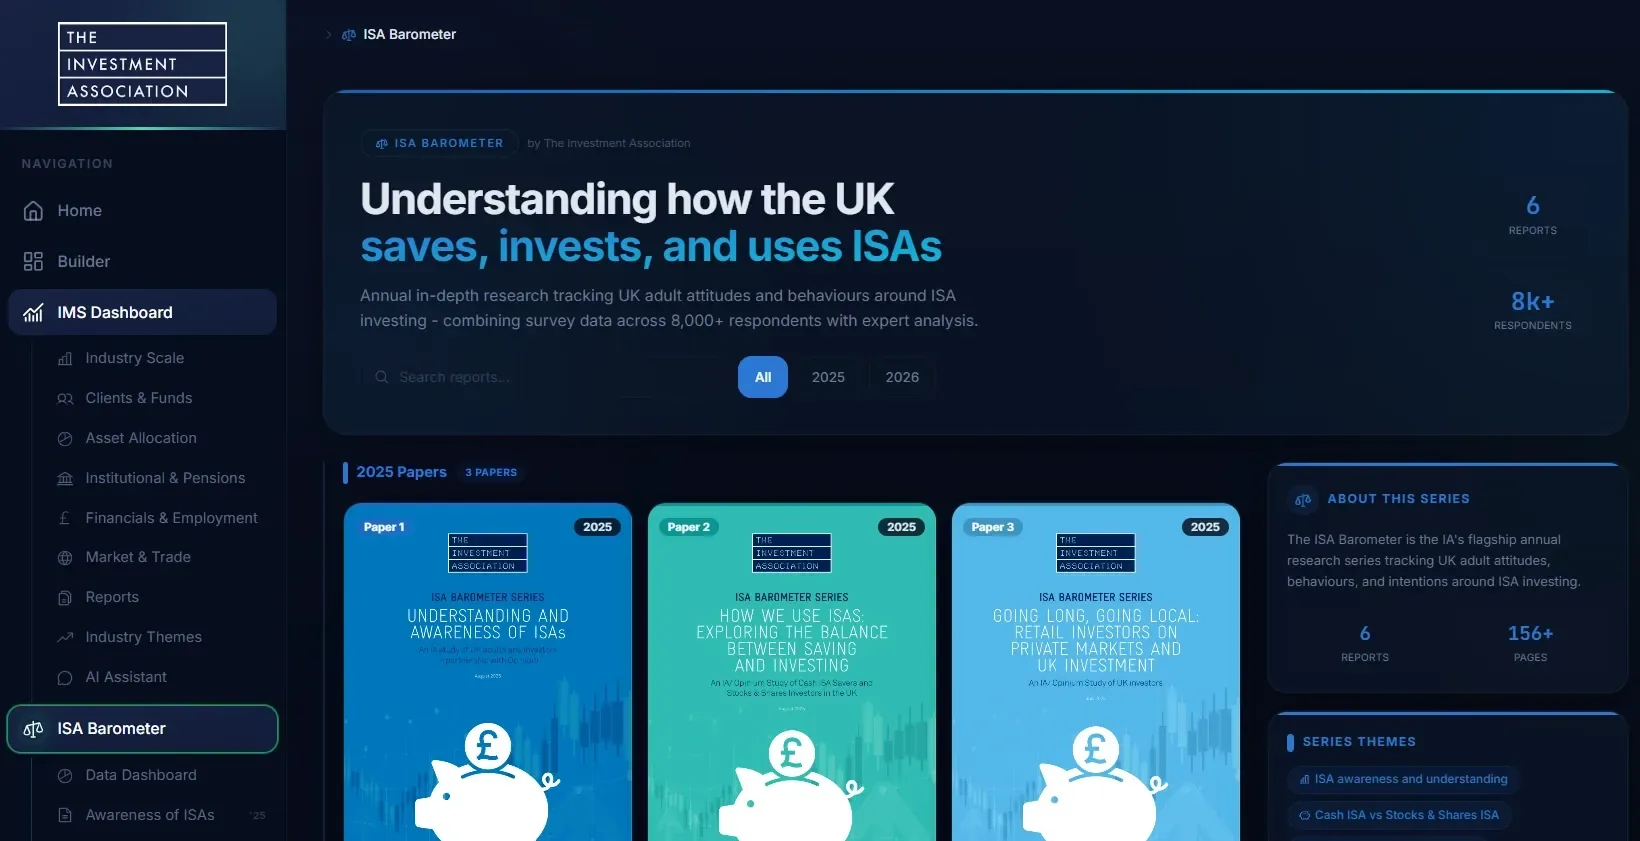
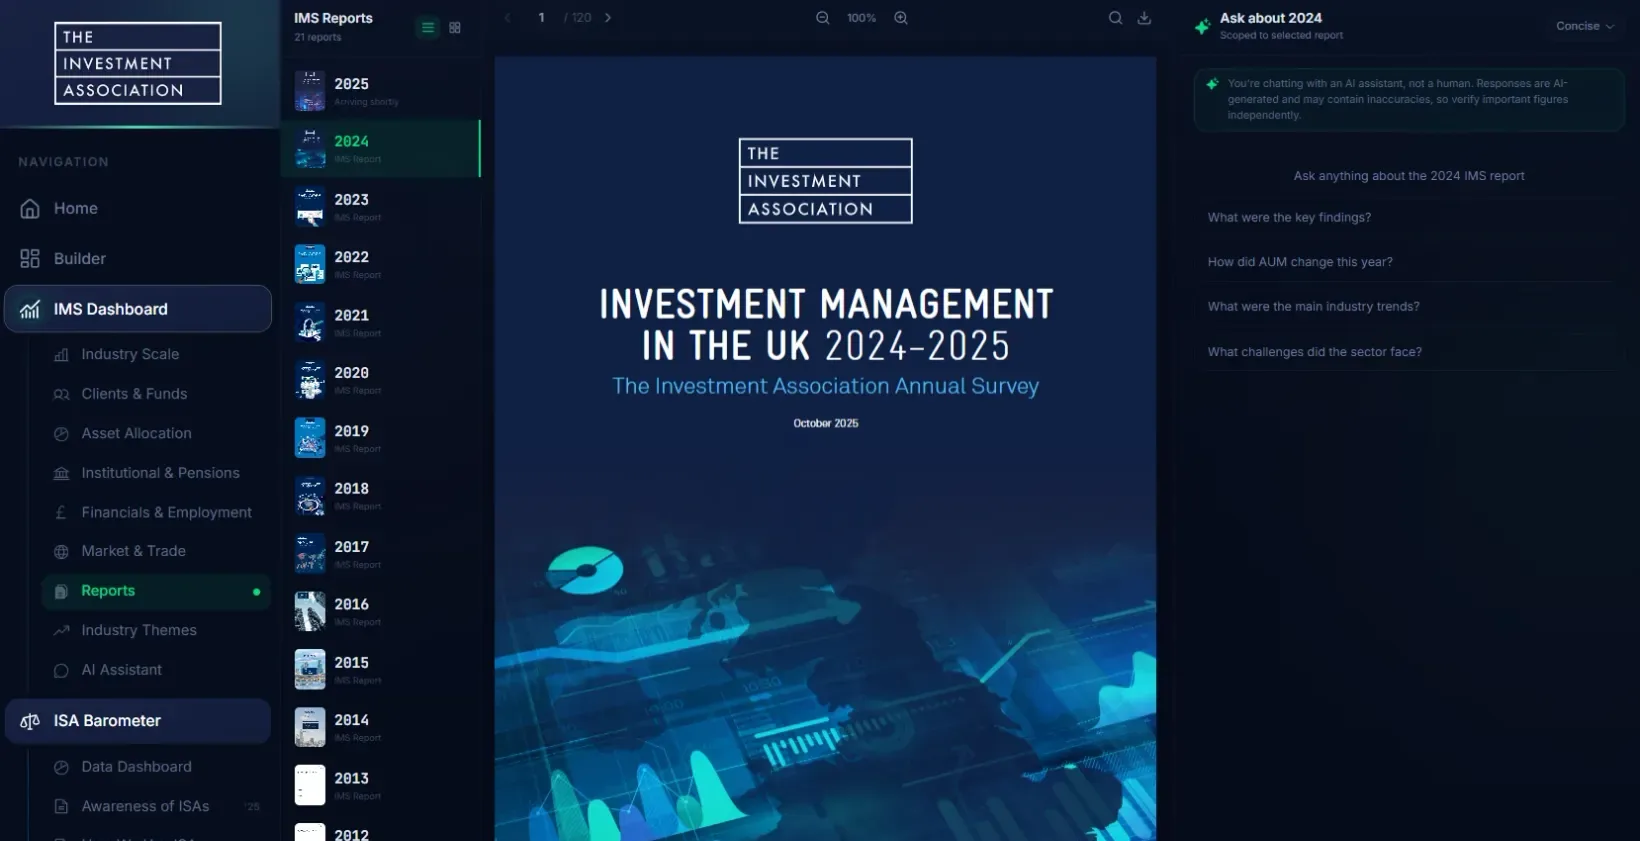
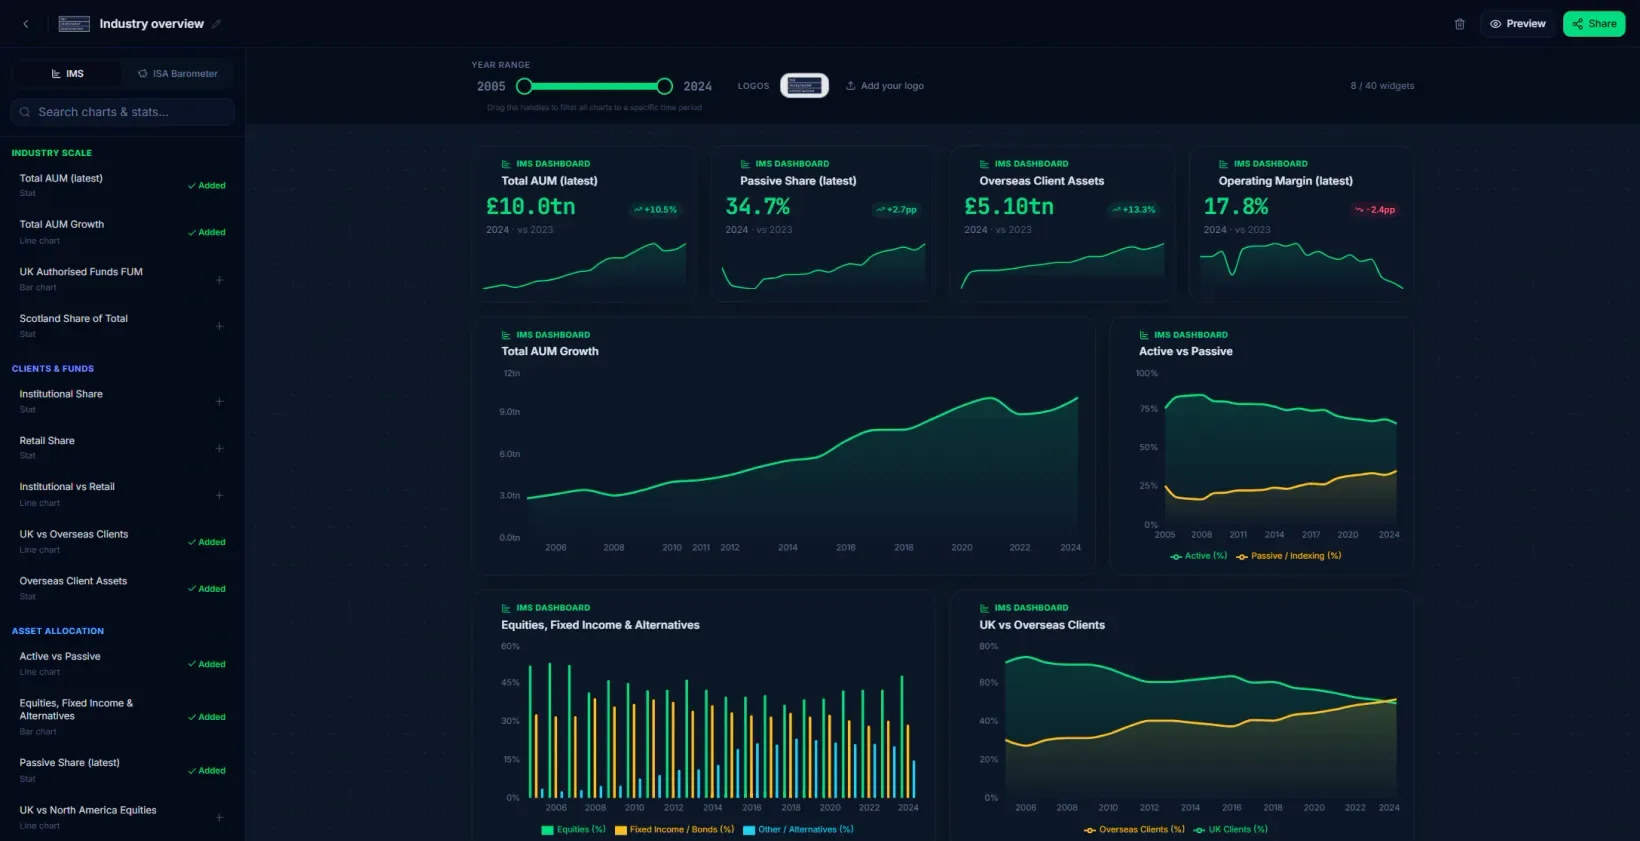
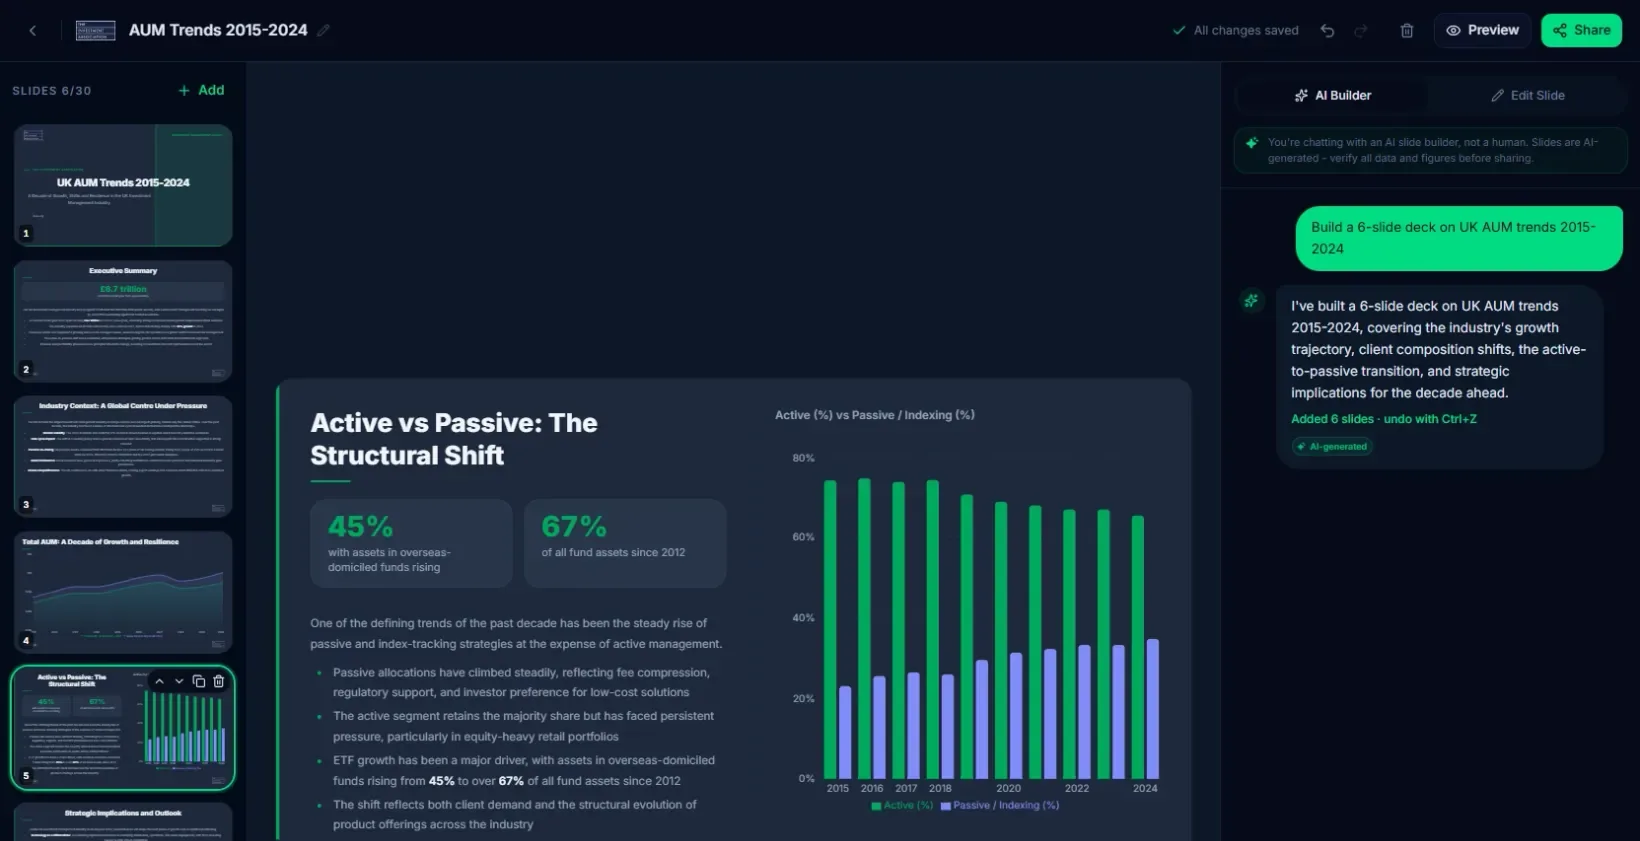
From our work: IA Intelligence Platform
Most businesses have more data than they know what to do with. Reports buried in spreadsheets, insights locked inside tools that do not talk to each other, and leadership teams making decisions based on information that is days or weeks out of date. A well-built data dashboard changes that.
We build custom data dashboards and analytics platforms for UK businesses, from internal operational reporting tools to client-facing data portals and industry intelligence platforms. We connect to your data sources, design visualisations that surface what matters, and build interfaces that people actually find useful to navigate.
Where appropriate, we add ML forecasting and AI-generated insight layers so the dashboard does not just show you what happened. It helps you understand why, and what to expect next. We have built platforms handling 20+ years of survey data, real-time operational metrics, and cross-source financial reporting.
What you get
- Data source audit and integration design
- Custom dashboard UI (Recharts, D3.js, or similar)
- Database design for analytics queries (PostgreSQL)
- Real-time and scheduled data ingestion pipelines
- Filters, drill-downs, and interactive visualisations
- ML forecasting and trend analysis (Python)
- AI natural-language query layer (optional)
- Export to CSV, PDF, and email reporting
- Role-based access for different dashboard views
Who it's for
Is this right for you?
Common scenarios where we can help. If yours fits, let's talk.
Operational reporting for business leaders
A live dashboard connecting your CRM, finance platform, and operational tools into one view. Revenue, pipeline, team performance, and operational metrics, all in one place, updated automatically.
Client-facing data portals
Give your clients a branded portal to view their data, reports, and performance metrics. Replaces static PDF reports with something interactive, always current, and professionally presented.
Industry research and intelligence platforms
Associations, research firms, and consultancies with survey or proprietary data that needs to be queryable, visualised, and presented to members or clients. We build the platform that brings the data to life.
Financial and investment data dashboards
Portfolio performance tracking, fund analytics, and compliance reporting tools. We have experience building dashboards for financial services contexts with appropriate data handling and access controls.
Tech stack
- Next.js
- TypeScript
- PostgreSQL
- Python
- Recharts
- D3.js
- Prisma
- OpenAI API
- ML Forecasting
Proof of work
See it in action.
A real project from this service area: the problem, our solution, and the results.
Financial Services (Member platform for The Investment Association, in pilot)
IA Intelligence Platform
The Investment Association has published its Investment Management Survey, the annual record of the UK investment management industry, for twenty years, alongside newer saver research in its ISA Barometer. All of it lived in static PDFs. The association's 250+ member firms, who between them manage £11.1 trillion, could read the reports but not work with them: comparing a figure across years meant opening a dozen documents, and getting a chart into a board pack meant retyping the numbers.
Read the case study- 20 years of Investment Management Survey data as live, filterable dashboards
- Every survey edition in one library, with an assistant that cites the page
- 126 ISA Barometer charts, each linked to its source page
- In pilot with IA members, who sign in with their existing IA account
FAQ
Common questions.
Everything you need to know before getting in touch.
Get started
Ready to discuss your project?
Book a free 30-minute call. We will ask the right questions, give you an honest assessment, and explain exactly how we would approach your project.